Analytics
Every published Instroc app comes with built-in visitor analytics, on every plan including Free. You do not add a tracking script, paste a snippet, or configure anything; once your app is live and people visit it, the numbers show up. This page explains what the analytics dashboard shows, where to find it, and when data starts appearing.
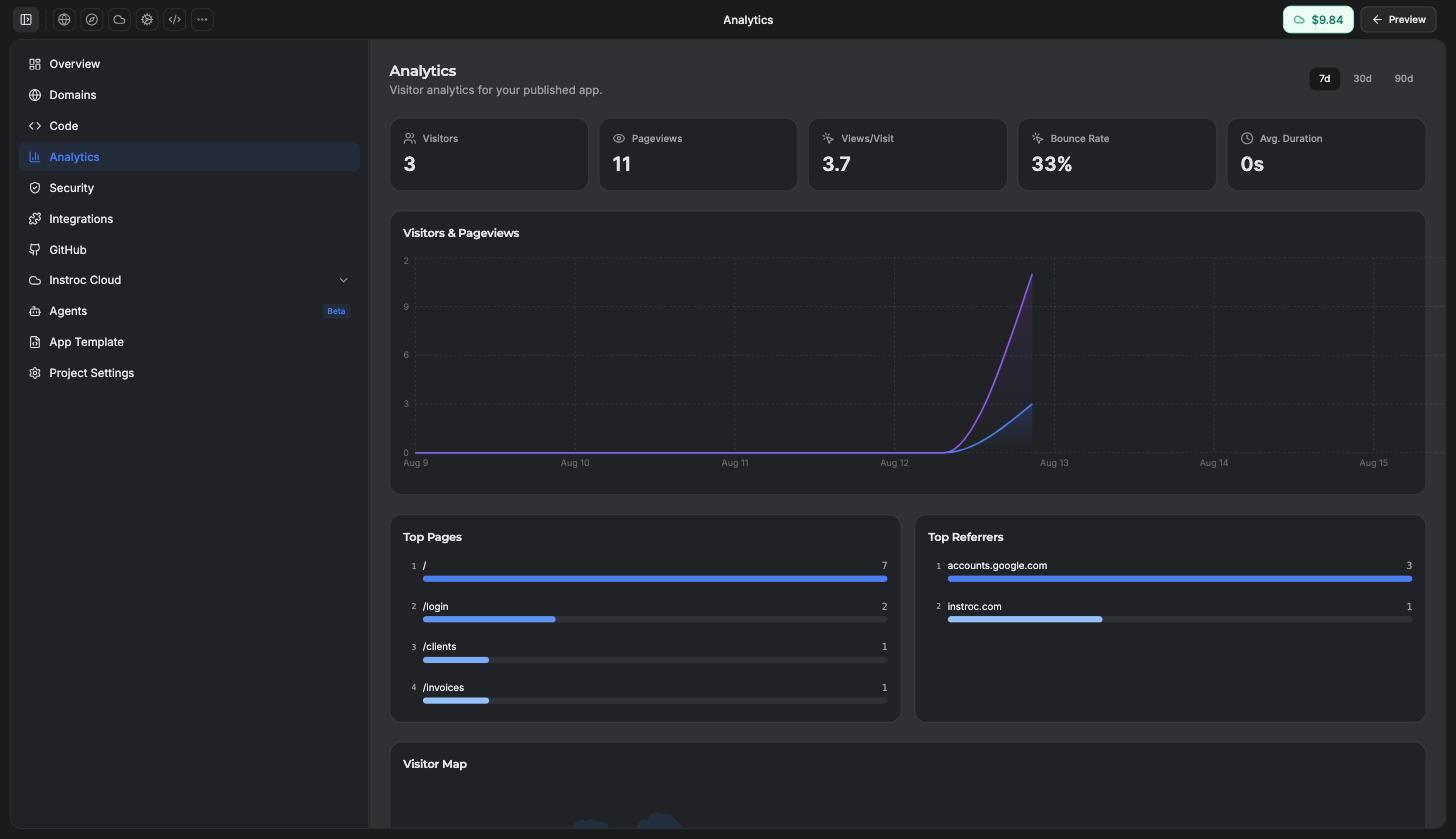
What you can see
The analytics dashboard opens with a row of stat cards summarizing how your app is doing over the selected period.
- Visitors: how many people came to your app.
- Pageviews: the total number of pages those visitors loaded.
- Views/Visit: how many pages a typical visit covers, a quick read on how deeply people explore.
- Bounce Rate: the share of visits that left after a single page.
- Avg. Duration: how long a typical visit lasts.
Below the cards, a chart plots traffic over time so you can spot spikes (a social post that landed) and quiet stretches. You can switch the range between the last 7, 30, or 90 days, and every card and chart follows the range you pick.
Pages, referrers, and the map
The dashboard also breaks traffic down by where it goes and where it comes from. Top pages shows which pages of your app get the most views, which is useful for learning what visitors actually care about versus what you expected them to care about. Top referrers shows which sites send you traffic, so you can tell whether visitors arrive from search, social links, or direct visits.
A visitor map shows where in the world your traffic originates, country by country. If you built an app for a local audience and the map says otherwise, that is worth knowing early.
Where to find analytics
There are two ways in. Inside the editor, open the Analytics section from the workspace navigation. From the dashboard, open a project card's menu and choose Analytics. Both routes land on the same dashboard for that app.
When data appears
Analytics tracks your published app, so data starts flowing once you have published and real visitors start arriving. Activity in the editor preview does not count as traffic. If your dashboard looks empty right after publishing, that just means nobody has visited yet; share your link and check back.
Analytics is included on every plan, including Free. It is one of the Free plan's listed benefits ("Analytics on every app"), so you never need to upgrade just to see how your app is doing.
Nothing to install, nothing to maintain
Most website analytics products ask you to create an account, copy a script tag, and paste it into your site's pages. Instroc skips all of that. Because Instroc serves your published app, measurement is built into the platform itself: every published app is measured automatically from the moment it goes live, and new pages you add are covered without any extra steps.
That also means analytics keeps working through the changes you make. Rename pages, restructure navigation, or restore an older version, and the dashboard keeps counting without you touching a configuration screen.
Using the numbers
A few practical habits get the most out of the dashboard. Check top referrers after any launch push to learn which channel actually delivered. Watch bounce rate on your landing page; a high number often means the headline does not match what visitors expected. And if one deep page dominates top pages, consider making it easier to reach from your homepage. When the numbers suggest changes, describe them to Roc in chat and the update is usually minutes away; see Roc, your AI builder.
For growing search traffic in the first place, pair analytics with good metadata. The SEO for your app page covers titles, descriptions, and social images that make your links look right in search results and shares.